Showing posts with label iPython. Show all posts

Saturday, August 27, 2016

Installation Quickstart: TensorFlow, Anaconda, Jupyter


What better way to start getting into TensorFlow than with a notebook technology like Jupyter, the successor to IPython Notebook? There are two little hurdles to achieve this:
  1. Choice of OS. Trying to use Windows with TensorFlow is as painful as trying to use Windows with Spark. But even within Linux, it turns out you need a recent version. CentOS 7 works a lot better than CentOS 6 because it has a more recent glibc.
  2. A step is missing from the TensorFlow installation page. From StackOverflow:
    conda install notebook ipykernel
Here then are the complete set of steps to achieve Hello World in Tensorflow on Jupyter via Anaconda:
  1. Use CentOS 7.2 (aka 1511), for example using VirtualBox if under Windows. This step may be unnecessary if you use OSX, but I just haven't tried it.
  2. Download and install Anaconda for Python 3.5.
  3. From the TensorFlow installation instructions:
    conda create -n tensorflow python=3.5
    source activate tensorflow
    conda install -c conda-forge tensorflow
  4. From StackOverflow:
    conda install notebook ipykernel
  5. Launch Jupyter:
    jupyter notebook
  6. Create a notebook and type in Hello World:
    import tensorflow as tf
    hello = tf.constant('Hello, TensorFlow!')
    sess = tf.Session()
    print(sess.run(hello))

Wednesday, December 31, 2014

Using Data To Predict Data Science in 2015


This is the time of the year when pundits make their 2015 predictions. But to make predictions about Data Science, shouldn't one use data? Here are four charts from Google Trends that show trending performance of various data science technologies. Apache Spark really is overtaking Apache Hadoop.


In this R vs. IPython Notebook chart, we should just gather the trends rather than the absolute magnitudes. "R" is notoriously difficult to Google for, and "R Cran" is just one of the many tricks R users employ to Google for information about R. And, sadly, Google Trends has no way to additively combine search trends together (e.g. "R Cran" OR "R Project"). But, we can still see that IPython Notebook is skyrocketing upward while R is sagging.


This is a little hard to read and requires some explaining. The former name for "Apache Storm" was "Twitter Storm" when Twitter first open-sourced Storm onto GitHub in 2011. But "Twitter Storm" has another common usage, which is a "storm of tweets" such as about a celebrity. I'm guessing about half the searches for "Twitter Storm" are for this latter usage.

The takeaway is that Storm got a two-year head start on Spark Streaming and has been chugging away ever since. Part of the reason is that Spark Streaming, despite the surge in popularity of base Spark, had a lot of catching up to do to Storm in terms of graceful handling of errors and graceful shutdown/restart. A lot of that is addressed in the new HA Spark Streaming features introduced in Spark 1.2.0, released a week ago.

But the other interesting trend is that the academic term "complex event processing" is falling away in favor of the more industry-oriented terms "Storm" and "Spark Streaming".


People forget that "Machine Learning" was quite popular back in the dot-com era. And then it started to fade. That is, until Geoffrey Hinton's invention of deep learning in 2006. That seems to have lifted the popularity of machine learning in general. Well, at least we can say there's a correlation.

The other interesting thing is the very recent (within the past month) uptick in interest in DeepMind. Of course there was a barrage of interest in October when the over-hyped headlines blared "mimics human". But I think people only this past month started getting past the hype and started looking at the actual DeepMind paper which is interesting because it shows how they added state to a neural network, and that that is how they achieved "short term memory".

Sunday, May 11, 2014

GeoSparkGrams: Tiny histograms on map with IPython Notebook and d3.js


Daily variation of barometric pressure (maximum minus minimum for each day) in inches, for the past 12 months. For each of the hand-picked major cities, the 365 daily ranges for that city are histogrammed.

Here "spark" is in reference to sparklines, not Apache Spark. Last year I showed tiny histograms, which I coined as SparkGrams, inside an HTML5-based spreadsheet using the Yahoo! YUI3 Javascript library. At the end of the row or column, a tiny histogram inside a single spreadsheet cell showed at a glance the distribution of data within that row or column.

This time, I'm placing SparkGrams on a map of the United States, so I call these GeoSparkGrams. This time I'm using IPython Notebook and d3.js. The notebook also automatically performs the data download from NOAA.

The motivation behind this analysis is to find the best place to live in the U.S. for those sensitive to barometric volatility.

The above notebook requires IPython Notebook 2.0, which was released on April 1, 2014, for its new inline HTML capability and ease of integrating d3.js.

Sunday, May 4, 2014

Matplotlib histogram plot from Numpy histogram data

Of course Pandas provides a quick and easy histogram plot, but if you're fine-tuning your histogram data generation in NumPy, it may not be obvious how to plot it. It can be done in one line:

hist = numpy.histogram(df.ix[df["Gender"]=="Male","Population"],range=(50,90))
pandas.DataFrame({'x':hist[1][1:],'y':hist[0]}).plot(x='x',kind='bar')

Thursday, August 29, 2013

Selecting Pandas data with list comprehension

Given a Dataframe, the Pandas "ix" method allows you to "query" the Dataframe with a condition that resembles a SQL WHERE clause:

df=DataFrame({'rank':[70,21,1000000],
              'domain':['www.cnn.com','www.msn.com','s.down.bad']})
df
domainrank
0www.cnn.com70
1www.msn.com21
2s.down.bad1000000
df.ix[df['rank']<100,:]
domainrank
0www.cnn.com70
1www.msn.com21

But even though "df['rank']<100" on its surface resembles a SQL WHERE clause, recall that the .ix method, like the R data frame after which it was patterned, isn't really taking a WHERE clause as its first parameter. It's taking an array of booleans. The df['rank']<100 is returning an array of booleans due to NumPy's broadcasting rules.

However, NumPy doesn't support every possible operator and function. For example, Numpy does not have string functions, since it is, after all, a numeric library. For composing Pandas dataframe selections based on string functions, we can use Python "list comprehension" to generate a list of booleans (which the ix method will accept as its first indexing parameter). A Pandas equivalent of SQL

SELECT *
FROM   df
WHERE  domain LIKE '%s%'

might be

df.ix[['s' in x for x in df['domain']],:]
domainrank
1www.msn.com21
2s.down.bad1000000

But as of Pandas 0.8.1 (released in 2012), Pandas supports operations on vectors of strings, similar to NumPy via str. Using str, the above Python list comprehension can be eliminated and replaced with the more simple alternative below. The .str.contains returns the array of booleans that .ix needs.

df.ix[df['domain'].str.contains('s'),:]

So Python list comprehension is not needed for simple numeric conditions (due to NumPy's broadcasting) or simple string conditions (due to Pandas string vectorization). More complex conditions, though, may still require Python list comprehension. As an example, we can query rows from the above data frame where only those websites are currently up:

import urllib2
def isup(domain):
    try:
        con = urllib2.urlopen(urllib2.Request('http://'+domain))
        return con.getcode() == 200
    except:
        return False

df.ix[[isup(x) for x in df['domain']],:]
domainrank
0www.cnn.com70
1www.msn.com21

Wednesday, August 21, 2013

Unsquish Pandas/Matplotlib bar chart x labels

For a line plot, Matplotlib intelligently chooses x axis ticks and labels. But for bar charts, it blindly tries to print one for each bar, regardless of how many bars there are or how small they are. This can result in labels overprinting each other.

To see an example and the corresponding solution, see my IPython Notebook Solving x axis overprinting on Pandas/Matplotlib bar charts on GitHub.

Before:

After:

Friday, August 9, 2013

Added PNG support to ipyD3: better nbconvert compatibility

Following the suggestion of the original author of ipyD3, I added PNG capability to my fork of his ipyD3. Then, selecting "png" instead of "html" generates output that appears nearly identical. Example invocation:

d3.render(mode=('show','png'))

The disadvantage of PNG over the former HTML rendering is that it precludes any possibility of mouse interaction and animation. The advantage is that nbconvert will convert multiple PNG D3 renderings in the same Notebook, whereas with the HTML renderings nbconvert seemed to give up after the first one. This is using the last version of nbconvert before it was merged into the IPython project. I have not tried the beta versions of IPython 1.0; I'm waiting for the Anaconda release.

Monday, July 29, 2013

Choropleth in D3.js and Pandas (IPython Notebook)

UPDATE 2014-06-08: This post is outdated as it is for IPython Notebook 1.0. Please see GeoSparkGrams: Tiny histograms on map with IPython Notebook and d3.js for IPython Notebook 2.0.


A lot of people have done a mash-up of D3 with IPython Notebook. Some efforts created a floating overlay over the Notebook rather than creating the output in the standard Notebook inline format. More recent efforts have utilized the Notebook's publish_html() to generate the output inline. One of the more advanced such efforts, ipyD3, however, works only on Windows. I've forked his gist and modified the couple of lines to make it Mac compatible. There is a small chance it's still Windows-compatible with my changes, but I haven't tested it. I'm almost certain the changes allow it to work on Linux too, but again, I've only tested it on a Mac.
I posted a notebook that generates the Choropleth below.
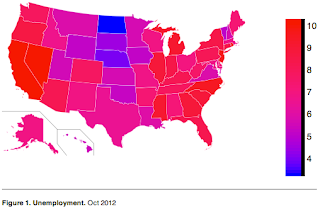
Besides demonstrating how to use D3 from IPython Notebook, it also demonstrates use of geographical maps in D3, itself not straightforward (or at least not built-in).
To transfer a Pandas Dataframe to ipyD3, I convert it to 2D Numpy array. In this particular example, I could have instead just converted the Dataframe to a dict and then passed a dict to ipyD3, since that is one of the data types it is able to marshal to the Javascript, but I wanted to show a more general approach of passing any Dataframe to ipyD3. Numpy arrays preserve column order, unlike quick examples I found on the web of converting Dataframes to JSON (which use non-order preserving dicts as an intermediate form), but at the expense of stripping out the column names. If your custom D3.js code needs column names, you'll have to pass that in as an additional Javascript variable.
The map shape data comes from Wikipedia, which has each state conveniently identified by its two-letter postal code for the SVG id and by the SVG class name of "state". The unemployment data is just something I found on GitHub.
Before executing this example, you'll need to download the ipyD3.py from my gist and put it in the same directory as where you launch IPython Notebook from.
Printing is a challenge. The "long paper" PDF technique below works, but only on the first inline ipyD3. The publish_html technique employed by ipyD3 is not foolproof; full-fledged D3.js support is not expected in IPython Notebook until version 2.0 (and version 1.0 isn't even out yet).
UPDATE 2013-07-30: Forgot to mention that you also need to install and download PhantomJS.
UPDATE 2013-08-06: I discovered it's possible to convert a Pandas Dataframe to a Numpy array directly with just array() and dropping the .to_records().tolist(). Doing so drops the first column, the row indexes, but those are not usually needed. If you modify my example to omit the .to_records().tolist(), you'll also need to reduce each of the hard-coded Javascript column indexes by 1.
UPDATE 2014-06-08: This post is outdated as it is for IPython Notebook 1.0. Please see GeoSparkGrams: Tiny histograms on map with IPython Notebook and d3.js for IPython Notebook 2.0.

Friday, July 19, 2013

On Mac, only Firefox can PDF without page breaks

An alternative to nbconvert for IPython Notebook is to specify a long custom page size, such as 8.5"x60". This will work for any web page, not just IPython Notebooks. But on a Mac, this option has been removed from Safari 6 and is not available on the current Chrome version. Firefox still lets you, however:

  1. In the Firefox drop-down menu, select File->Page Setup->Paper Size->Manage Custom Sizes...
  2. In the Custom Paper Sizes dialog, click the "+" button beneath the list box on the left to add a new custom paper size.
  3. Click the newly created name to change the name to something meaningful.
  4. Change the Paper Size Height to something like 60 inches and click OK.
  5. As normal, from the Firefox menu select File->Print and then in the Print dialog click PDF->Save as PDF.

Monday, July 15, 2013

Quick link to download nbconvert

As a quick update to my nbconvert post, the nbconvert code has been deleted from its github tip and merged into the main IPython project. The problem is, IPython 1.0 isn't out yet. To use nbconvert with the current IPython 0.13 release, you can download the last stand-alone nbconvert .zip archive from https://github.com/ipython/nbconvert/archive/173bb08dd86d02a7485801969c94d4816913cd09.zip.

UPDATE 2013-07-17: Announcement today on the ipython-dev mailing list that IPython 1.0 won't be released until early August.

Monday, July 1, 2013

nbconvert: PDF from iPython Notebook

UPDATE 2013-07-19: For details on the alternative to nbconvert briefly mentioned below, long custom PDF page sizes, see On Mac, only Firefox can PDF without page breaks.

UPDATE 2013-07-15: See Quick link to download nbconvert for updated download location.

The official iPython Notebook documentation states that to convert a notebook to PDF, you should use your browser's "Print to PDF" capability. The problem is that that chops charts and graphs in half due to PDF pagination (unless you are able to configure a custom PDF paper size e.g. 60 inches long).

A command-line utility, nbconvert, which will eventually be merged into IPython but is not yet, nicely converts Notebooks to PDF. It even includes nice instructions on installing on a Mac, but the instructions are only 98% complete. Below are the missing steps:

  1. Download the nbconvert package as a Zip and unzip to your home directory.
  2. Follow the steps from https://github.com/ipython/nbconvert/blob/173bb08dd86d02a7485801969c94d4816913cd09/README.rst, specifically:
    1. pip install jinja2
    2. pip install markdown
    3. curl http://docutils.svn.sourceforge.net/viewvc/docutils/trunk/docutils/?view=tar > docutils.tgz
    4. pip install -U docutils.tgz
    5. pip install pygments
    6. sudo easy_install -U sphinx
    7. Install PanDoc via the installer http://code.google.com/p/pandoc/downloads/list
    8. Install MacTex via the .pkg http://www.tug.org/mactex/
  3. Execute to convert your .ipynb to .pdf:
    export PYTHONPATH=~/nbconvert-master/nbconvert/utils
    python ~/nbconvert-master/nbconvert1/nbconvert.py --format=pdf MyNotebook.ipynb
    

Wednesday, June 26, 2013

Create empty DataFrame in Pandas

It seems like it should be a simple thing: create an empty DataFrame in the Pandas Python Data Analysis Library. But if you want to create a DataFrame that

  • is empty (has no records)
  • has datatypes
  • has columns in a specific order

...i.e. the equivalent of SQL's CREATE TABLE, then it's not obvious how to do it in Pandas, and I wasn't able to find any one web page that laid it all out. The trick is to use an empty Numpy ndarray in the DataFrame constructor:

df=DataFrame(np.zeros(0,dtype=[
('ProductID', 'i4'),
('ProductName', 'a50')]))

Then, to insert a single record:

df = df.append({'ProductID':1234, 'ProductName':'Widget'})

UPDATE 2013-07-18: Append is missing a parameter:

df = df.append({'ProductID':1234, 'ProductName':'Widget'},ignore_index=True)

Thursday, June 13, 2013

Query Hive from iPython Notebook

iPython Notebook together with pandas comprise a data analysis system that is essentially a clone of R. The advantage over R is that Python code can be more easily converted into production code and executed, for example, on a web server.

One limitation is that the Apache-recommended Python interface to Hive requires installing Hive locally, which can be problematic or inconvenient from, say, a laptop used for analysis. A nice alternative is remotely executing Hive on the Hadoop cluster (or adjacent Linux server with access to the cluster). The alternative does require installing sshpass. At the end of the code below, the query results are stored in a pandas DataFrame with column names and automatic detection of data types.

from pandas import *
from StringIO import StringIO

s = "sshpass -f myfilewithpassword ssh myusername@myhostname \"hive -S -e \\\"" \
"set hive.cli.print.header=true;" \
"SELECT * from mytable;\\\"\""

t = !$s
df = read_csv(StringIO(t.n), sep='\t')

UPDATE 2013-08-01: It's a bit cleaner if one uses Python's triple-quoting mechanism as below. This allows one to copy and paste queries between iPython Notebook and Hive and Hue without having to reformat with quotes and backslashes.

from pandas import *
from StringIO import StringIO

s = """
sshpass -f myfilewithpassword ssh myusername@myhostname \"
hive -S -e \\\"
set hive.cli.print.header=true;
SELECT * from mytable;
\\\"\"
"""

t = !$s
df = read_csv(StringIO(t.n), sep='\t')