A lot of people have done a mash-up of D3 with IPython Notebook. Some efforts created a floating overlay over the Notebook rather than creating the output in the standard Notebook inline format. More recent efforts have utilized the Notebook's publish_html() to generate the output inline. One of the more advanced such efforts, ipyD3, however, works only on Windows. I've forked his gist and modified the couple of lines to make it Mac compatible. There is a small chance it's still Windows-compatible with my changes, but I haven't tested it. I'm almost certain the changes allow it to work on Linux too, but again, I've only tested it on a Mac.
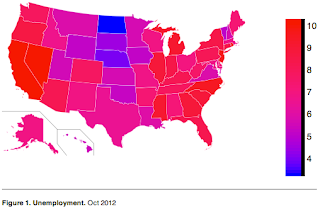
I posted a notebook that generates the Choropleth below.

Besides demonstrating how to use D3 from IPython Notebook, it also demonstrates use of geographical maps in D3, itself not straightforward (or at least not built-in).
To transfer a Pandas Dataframe to ipyD3, I convert it to 2D Numpy array. In this particular example, I could have instead just converted the Dataframe to a dict and then passed a dict to ipyD3, since that is one of the data types it is able to marshal to the Javascript, but I wanted to show a more general approach of passing any Dataframe to ipyD3. Numpy arrays preserve column order, unlike quick examples I found on the web of converting Dataframes to JSON (which use non-order preserving dicts as an intermediate form), but at the expense of stripping out the column names. If your custom D3.js code needs column names, you'll have to pass that in as an additional Javascript variable.
The map shape data comes from Wikipedia, which has each state conveniently identified by its two-letter postal code for the SVG id and by the SVG class name of "state". The unemployment data is just something I found on GitHub.
Before executing this example, you'll need to download the ipyD3.py from my gist and put it in the same directory as where you launch IPython Notebook from.
Printing is a challenge. The "long paper" PDF technique below works, but only on the first inline ipyD3. The publish_html technique employed by ipyD3 is not foolproof; full-fledged D3.js support is not expected in IPython Notebook until version 2.0 (and version 1.0 isn't even out yet).
UPDATE 2013-07-30: Forgot to mention that you also need to install and download PhantomJS.
UPDATE 2013-08-06: I discovered it's possible to convert a Pandas Dataframe to a Numpy array directly with just array() and dropping the .to_records().tolist(). Doing so drops the first column, the row indexes, but those are not usually needed. If you modify my example to omit the .to_records().tolist(), you'll also need to reduce each of the hard-coded Javascript column indexes by 1.
UPDATE 2014-06-08: This post is outdated as it is for IPython Notebook 1.0. Please see GeoSparkGrams: Tiny histograms on map with IPython Notebook and d3.js for IPython Notebook 2.0.
No comments:
Post a Comment